| Assisted vs regular models comparison. Model: S0981TS208_2-D5 |
|
|
|
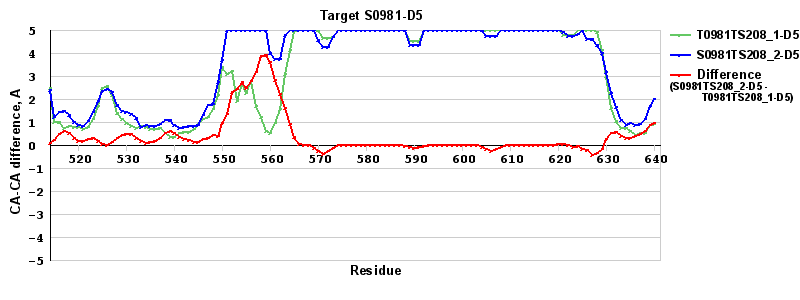
| Green line: distance between the aligned CA atoms in the regular model and the experimental structure in the LGA sequence-independent superposition under the 4A distance cutoff (see LGA description). |
| Blue line: distance between the corresponding CA atoms in a "assisted model" and the experimental structure in the LGA sequence-independent superposition under the 4A distance cutoff. |
| Red line = (blue line) - (green thick line): difference between the corresponding "Assisted Model"-Target and "Regular Model"-Target CA-CA distances (see above). Negative values show regions where the "assisted" model has better fit to the target than the reference model, i.e. areas of potential improvement. |
|

